Austin Animal Center Data Explorer

Increasing the shelter's adoption rate with data insights and machine learning
Language: Python
🎉 The App won 3rd place in the Plotly Summer App Challenge 🎉
1 Disclaimer
The Austin Animal Center (AAC) Data Explorer is a web app developed for the Plotly Summer Community App Challenge. The challenge has not been initiated by the AAC and the resulting app is not a product of the AAC. It is Open Source and is not intended to be commercialized.
2 Data Sourcing
The data used to build the app come from Kaggle. The data relative to the shelter intakes were directly sourced from the AAC API.
2 Data Explorer
The *Explore Data page* displays key data and figures about the shelter’s intakes and outcomes. Thanks to [Plotly](https://plotly.com/), every graph is highly interactive and allows the following features:
The map on the right panel of the page was built using [mapbox](https://www.mapbox.com/) and also allows a maximum interactivity.
2 Predictions
The Predict page allows the app user to enter a series of parameters about a new animal intake. The “predict” button will then plug-in those parameters into a trained machine-learning model to determine whether the animal will be adopted or not (see model specifications below).
The model used to determine whether an animal will be adopted or not is a Gradient Boosting Classifier - an ensemble classification model. The best hyper-parameters were determined using a RandomizedSearchCV:
learning_rate=0.1max_depth=20min_samples_leaf=1min_samples_split=2n_estimators=100tol=0.0001subsample=0.5validation_fraction=0.1The best model has an overall accuracy of 86% (i.e. the model predicts the right outcome 86% of the time). Below is the “confusion matrix” displaying the model’s overall performance, where the label 0 is “will not be adopted” and the label 1 is “will be adopted”:
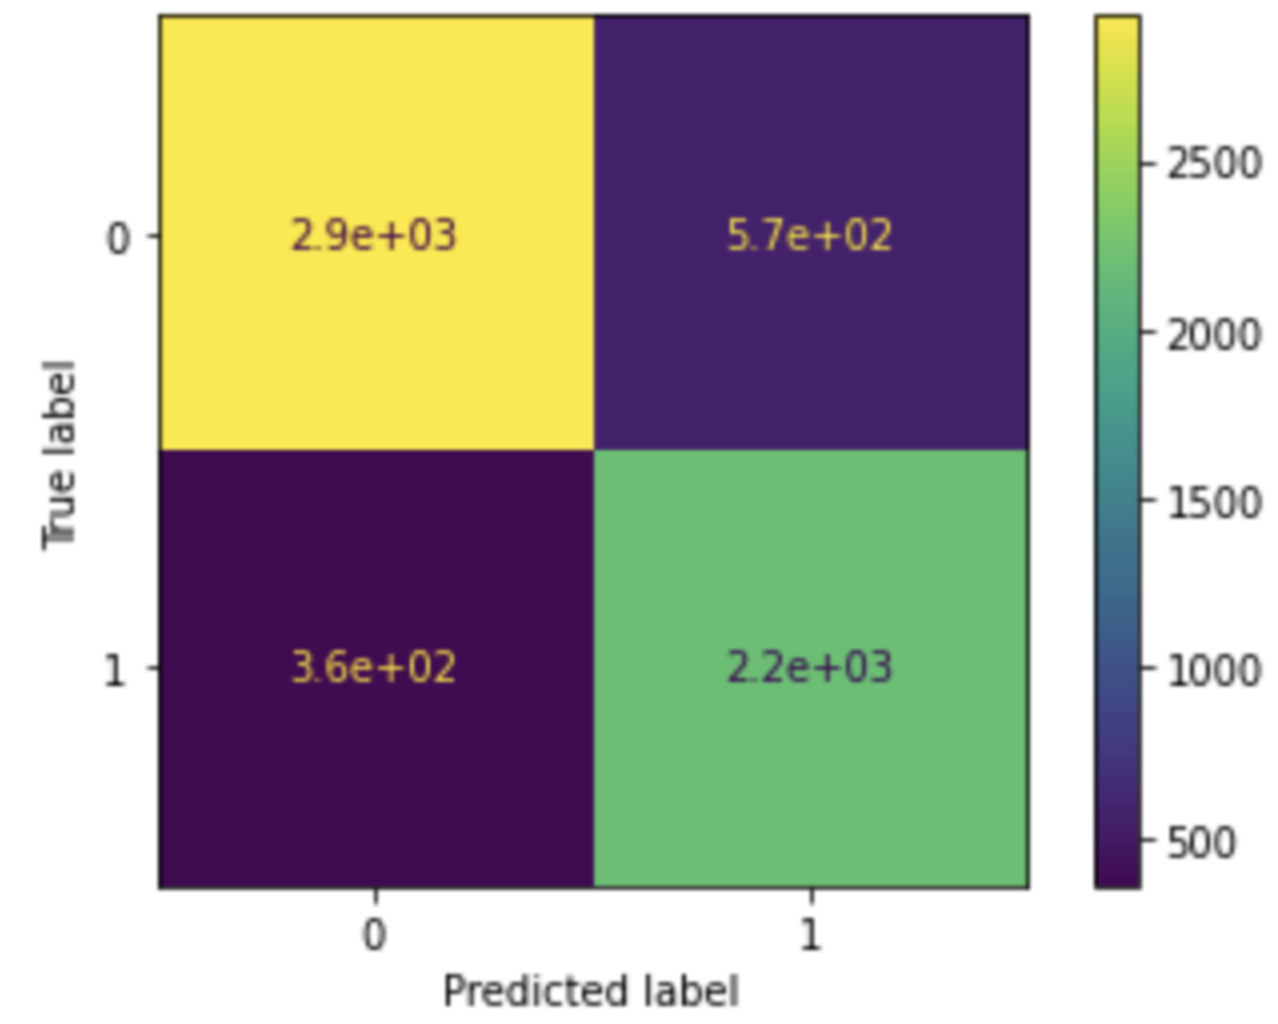
The worst errors occur when an animal is falsely predicted to be adopted while in reality it will most likely not be adopted. This type of error is reflected in the upper right corner and represents 7.8% of all predictions.